

Bitcoin faced intense selling pressure following renewed geopolitical tensions in the Middle East, as Israel launched a preemptive strike on Iran. The news sent shockwaves through global financial markets, triggering a wave of risk-off sentiment and sharp liquidations across major crypto exchanges. BTC dropped over 5% in the aftermath, briefly dipping below key moving averages but ultimately holding firm above the $100,000 psychological mark.
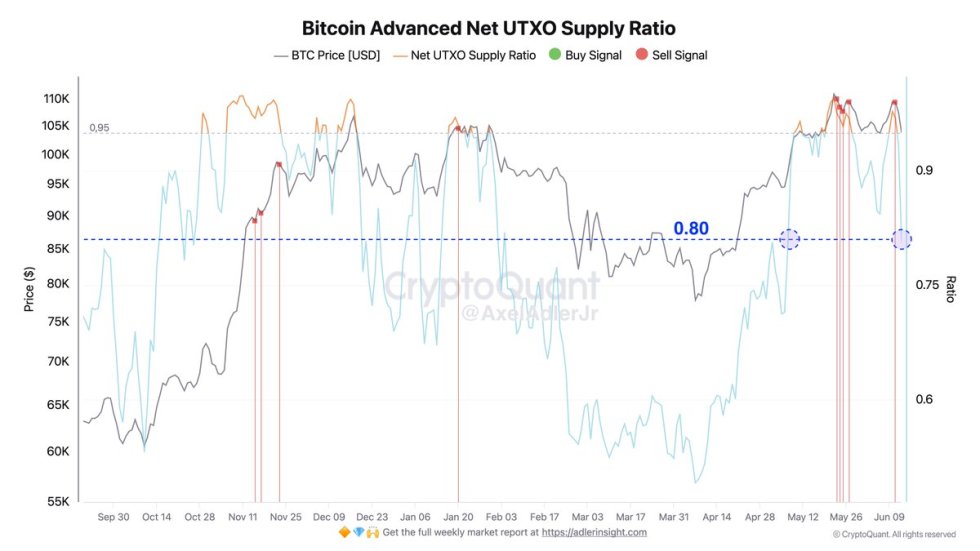
Despite the spike in volatility, analysts remain cautiously optimistic. Top analyst Axel Adler shared data showing that the Advanced Net UTXO Supply Ratio—a key metric for identifying market inflection points—fell sharply from a local peak of 0.96 on June 11 to 0.806 just 48 hours later. Historically, if this ratio continues its downtrend and stabilizes below 0.80 on the daily chart, it flashes a classic “buy signal,” often preceding strong market recoveries.
With BTC holding crucial support and long-term holder conviction remaining high, many market participants are watching closely for confirmation of a bottom. As the macro narrative evolves, all eyes are on Bitcoin’s ability to maintain its footing and potentially use this correction as a base for its next leg higher.
Bitcoin Prepares For Expansion Amid Geopolitical Volatility
Bitcoin is approaching a pivotal moment as it hovers near the $104K–$105K region, with analysts eyeing a potential breakout past the $112K all-time high. A successful push above this resistance could trigger an explosive market expansion and send BTC into a new price discovery phase. While bulls appear to be in control, growing macroeconomic risks—including heightened Middle East tensions, persistent inflation fears, and rising US Treasury yields—are creating a volatile environment that challenges investor confidence.
Adler highlighted a critical on-chain signal: the Advanced Net UTXO Supply Ratio, which peaked at 0.96 on June 11, has since declined to 0.806. Historically, if this ratio dips below 0.80 on the daily chart and holds, it often marks a textbook “buy signal,” signaling strong accumulation. Adler notes that a short-term base for a new micro-rally could form around the $102K–$105K range. However, if the ratio continues to decline and BTC breaks below $100K, the market could see a renewed wave of selling pressure.
Over the past 24 hours, risk-off sentiment has intensified across global markets. Oil and gold spiked as investors sought safety amid fears of broader regional conflict. Meanwhile, equity markets slid sharply following Israel’s preemptive strike on Iran. In crypto, over $360 million in long positions were liquidated overnight across major centralized exchanges, underscoring the fragility of sentiment.
Despite the turbulence, Bitcoin’s ability to stay above key support zones suggests resilience. Market watchers are closely monitoring the $100K–$105K area as the battleground that could determine whether BTC consolidates for a bullish breakout or enters a deeper correction.
BTC Price Analysis: Critical Support At $103,600 Holds The Key
The chart shows Bitcoin trading at $105,056 after a volatile drop from the $112K level earlier this week. BTC is currently hovering just above a crucial support zone between $103,600 and $105,000. This range has acted as both resistance and support multiple times in recent months and now serves as a key battleground for the short-term trend.
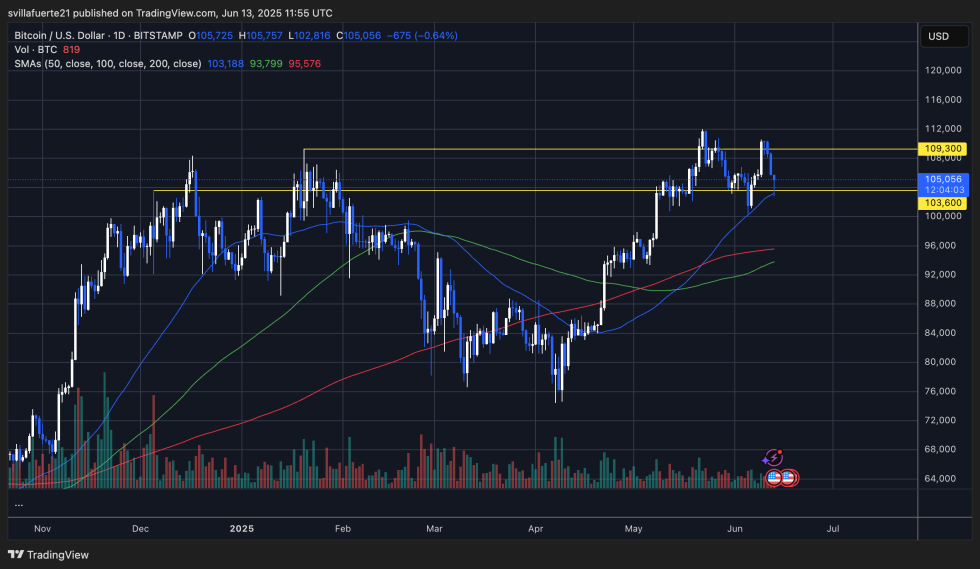
The 50-day moving average sits near $103,188 and aligns closely with horizontal support at $103,600, reinforcing this area as a potential bounce zone. If bulls can hold this level, the setup remains constructive for another attempt at the $109,300 resistance, which has capped upside movements throughout May and June.
However, the recent spike in volume during the latest decline suggests increased selling pressure, likely tied to macro headlines, including the Israel-Iran conflict. If price closes below $103,600, the next significant support could be found around the 100-day moving average near $93,799.
For now, BTC is consolidating above support, but the path forward depends on whether bulls can defend this zone and reclaim momentum toward $112K. A confirmed breakdown could invalidate the bullish structure and open the door to a deeper retracement.
Featured image from Dall-E, chart from TradingView

Editorial Process for bitcoinist is centered on delivering thoroughly researched, accurate, and unbiased content. We uphold strict sourcing standards, and each page undergoes diligent review by our team of top technology experts and seasoned editors. This process ensures the integrity, relevance, and value of our content for our readers.

