

Reason to trust
Strict editorial policy that focuses on accuracy, relevance, and impartiality
Created by industry experts and meticulously reviewed
The highest standards in reporting and publishing
Strict editorial policy that focuses on accuracy, relevance, and impartiality
Morbi pretium leo et nisl aliquam mollis. Quisque arcu lorem, ultricies quis pellentesque nec, ullamcorper eu odio.
Este artículo también está disponible en español.
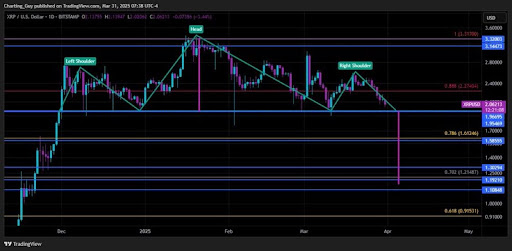
Recent XRP price action has sparked a new prediction from a crypto analyst, as a potential Head and Shoulders pattern emerges on the chart. The analyst warns that this technical formation could trigger a significant price correction for XRP, describing this downturn as the worst-case scenario.
Analyst Predicts XRP Price Crash To $1.15
The ‘Charting Guy,’ a pseudonymous crypto analyst on X (formerly Twitter), has unveiled a potential Head and Shoulder pattern formation on the XRP price chart. The analyst has shared insights into the implications of this technical pattern, projecting a potential crash in the XRP price.
Related Reading
As a well-known bearish reversal pattern, the formation of a Head and Shoulder in the XRP price chart suggests a potential shift from an uptrend to a downtrend. Typically, a Head and Shoulder pattern consists of three peaks: the Left Shoulder, Head, and Right Shoulder. However, the Charting Guy has confirmed that XRP’s current pattern formation consists of two right shoulders and one head. Due to this irregularity, the analyst has expressed doubt about the possibility of the pattern playing out.
If the Head and Shoulder pattern eventually takes shape, it could lead to a significant drop in the XRP price, potentially bringing it down to as low as $1.15. This price level aligns with a key Fibonacci Golden Pocket retracement zone between 0.618 – 0.786.
Notably, the analyst has described this projected price crash as the worst-case scenario for XRP. While he believes a bearish move is possible, the analyst is confident that XRP’s broader market structure is bullish.
Moreover, the Charting Guy argues that if XRP does decline to $1.15, it would likely serve as a healthy retracement in an overall bullish trend. He noted that XRP’s price has been holding the $2 level on daily closes, meaning its price action remains strong above support levels. This also indicates the possibility of an uptrend resumption that could yield higher highs and higher lows for XRP.
Key Support And Resistance Levels To Watch
The Charting Guy’s analysis of XRP’s potential Head and Shoulder pattern formation highlights several critical price levels to watch. Since XRP has consistently closed daily candles above $2, the analyst has determined this level as short-term support.
Related Reading
XRP has also been wicking during recent pullbacks in a crucial range between $1.7 and $1.9. As a result, the crypto analyst has revealed that he will be watching this area closely for a potential price bounce.
The Golden Pocket retracement zone, which represents the worst-case scenario for the XRP price, is between $1.15 and $1.30. If XRP experiences a deeper price correction, lower support levels have been marked from $1.19 to $0.91.
For its resistance levels, the Charting Guy has pinpointed $2.27 as a key price point. Additionally, $3.14 – $3.32 has been identified as an upper resistance range where XRP could rally if bullish momentum resumes.
Featured image from Medium, chart from Tradingview.com

